When it comes to building a sustainable path toward financial growth, perhaps no concept is as foundational—or as debated—as the 60/40 portfolio. For decades, this classic asset allocation model has served as the bedrock for pension funds, retirement planners, and retail investors alike. But what exactly makes this specific ratio so durable, and why does the interplay between equities and fixed income remain the primary framework for risk-adjusted management?
In this long-form analysis, we will dive deep into nearly a century of financial history. We will explore how different allocations—from full equity exposure to conservative bond-heavy models—have performed through the Great Depression, the post-WWII boom, the stagflation of the 1970s, and the modern digital era.
Understanding the Mechanics: What is a 60/40 Portfolio?
At its core, a 60/40 portfolio is a strategy that allocates 60% of an investor’s capital to equities (stocks) and 40% to fixed income (bonds). The philosophy behind this split is rooted in the concept of modern portfolio theory: the idea that by combining two asset classes that often move in different directions (uncorrelated or negatively correlated), an investor can capture much of the stock market's growth while using bonds to "smooth out" the volatile swings.
Why the Split Matters
To understand the 60/40 model, we must first understand the two "poles" of the investment spectrum:
- 100% Equity Exposure: Historically the "growth engine." Stocks represent ownership in companies. They offer the highest potential for long-term compounding but come with significant "drawdowns" (large, temporary losses during market crashes).
- 100% Bond Exposure: Historically the "safety net." Bonds are essentially loans to governments or corporations. They provide regular interest payments and are generally less volatile than stocks, though they offer lower long-term total returns.
The 60/40 ratio is designed to be a "sweet spot." It provides enough equity exposure to outpace inflation and build real wealth over time, while keeping enough in bonds to provide a psychological and financial cushion when the stock market enters a "correction" or a bear market.
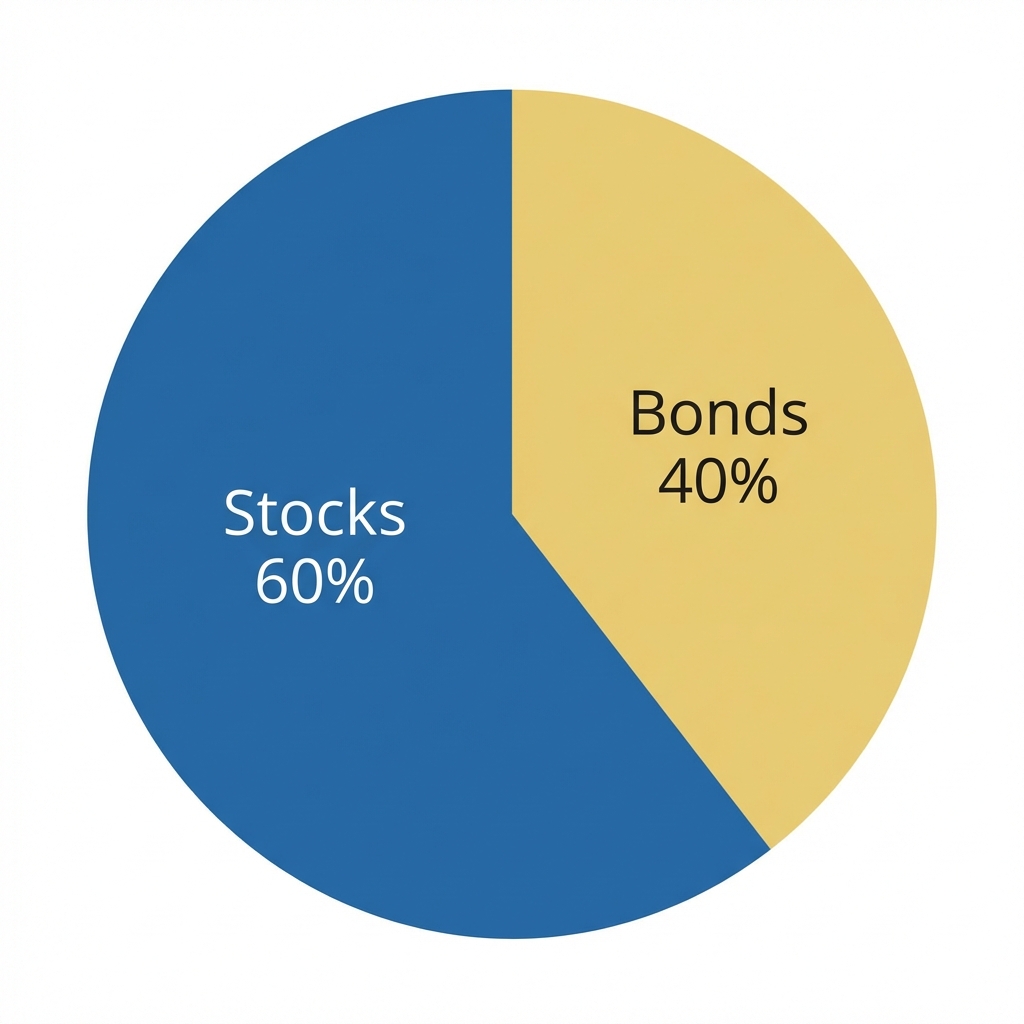
A visual representation of the traditional 60/40 asset allocation model.
The strength of the 60/40 model isn't just theoretical; it is backed by 97 years of market cycles. According to the Vanguard Asset Allocation History, the 60/40 portfolio historical returns have averaged 8.6% annually from 1926 through the end of 2022. To put this in context, let's look at the average annual returns across the full spectrum of risk.
Average Annual Returns by Allocation (1926–2022)
| Allocation (Stocks/Bonds) | Average Annual Return | Best Year | Worst Year |
| 100% Stocks / 0% Bonds | 10.2% | +54.2% | -43.1% |
| 80% Stocks / 20% Bonds | 9.6% | +45.4% | -34.9% |
| 60% Stocks / 40% Bonds | 8.6% | +36.7% | -26.6% |
| 40% Stocks / 60% Bonds | 7.6% | +28.4% | -18.4% |
| 20% Stocks / 80% Bonds | 6.6% | +31.2% | -10.1% |
| 0% Stocks / 100% Bonds | 5.3% | +32.6% | -8.1% |
Looking at these numbers, several critical insights emerge for the retail investor:
- The Opportunity Cost of Safety: Moving from a 100% stock portfolio to a 100% bond portfolio nearly halves your average annual return (from 10.2% to 5.3%). Over 30 or 40 years, this difference can amount to millions of dollars in final portfolio value due to the power of compound interest.
- The Volatility Buffer: While the 100% stock portfolio returned more on average, its worst one-year return was a staggering -43.1% (in 1931). For many investors, seeing their life savings drop by nearly half in 12 months is psychologically unbearable, often leading to panic selling at the bottom.
- The 60/40 Compromise: The 60/40 portfolio captured about 84% of the returns of a full-stock portfolio but reduced the worst-case annual loss from -43% to -26.6%. This is the essence of risk-adjusted portfolio management.
The Spectrum of Risk: From 0% to 100% Equities
One common misconception is that a 60/40 portfolio is a "one-size-fits-all" rule. In reality, asset allocation is a spectrum. Depending on where an investor is in their lifecycle—whether they are a 22nd-year-old just starting their career or a retiree seeking to preserve wealth—the ideal ratio may shift toward more aggressive or more conservative asset allocation model portfolios.
Aggressive Growth (80% to 100% Stocks)
For those with a high tolerance for risk and a long time horizon (15+ years), high equity exposure has historically been the most effective way to build wealth. While the "valley of the shadows" in 1931 saw a 43% drop, the "mountain peaks" of 1933 saw a 54% gain. High equity exposure requires the discipline to ignore short-term market noise and focus exclusively on long-term business productivity.
Conservative Income (20% to 40% Stocks)
As investors age, the focus often shifts from wealth creation to wealth preservation. A 30% stocks / 70% bonds allocation or even a 40/60 portfolio (based on the end you approach it from) prioritized stability. These portfolios rarely experience double-digit losses, but they also struggle to keep up with aggressive inflation if held for too long without enough equity growth.
The Middle Ground: 40/60 to 60/40
The range between 40% and 60% equities is where the majority of balanced funds operate. It is the "all-weather" territory. Whether you call it a 60/40 or a 40/60 portfolio, this range tries to manage the "long-term consequences" of being too aggressive (losing capital in a crash) versus being too conservative (losing purchasing power to inflation).
Is This Applicable to Retail Investors?
The short answer is: Yes. In fact, understanding what is a 60/40 portfolio is perhaps more important for the retail investor than for the institutional professional. Institutions have the benefit of sophisticated hedging tools (options, futures, etc.) and infinite time horizons. The retail investor has limited capital and a finite working life.
Risk-Adjusted Management for the Individual
For a retail investor, the most dangerous risk isn't a market crash; it is human behavior. If a person chooses a portfolio that is too aggressive for their temperament, they are likely to sell during the 26.6% drawdowns of a 60/40 portfolio or the 43% drawdowns of a 100% stock portfolio. By intentionally choosing a suitable risk-adjusted portfolio management strategy, the investor increases their probability of staying the course.
Think of it like an airplane: Equities are the jet engines that provide the lift and speed to reach your destination. Bonds are the landing gear and the stabilizers that ensure a smooth ride through turbulence. You cannot fly without engines, but most people would prefer not to land without the gear.
The Long-Term Consequences of Improper Allocation
Failure to properly allocate assets generally leads to one of two outcomes over a 20-30 year period:
- The Conservative Trap: An investor who is too afraid of the "worst year" (-8% for bonds) stays entirely in fixed income. Over 50 years, the 5.3% return fails to capture the massive productivity gains of the global economy. They end up with significantly less purchasing power than had they accepted a 60/40 or 100% stock risk.
- The Aggressive Trap: An investor who wants the 10.2% return but hasn't planned for the -43% years. They enter the market at a peak, experience a crash, and exit the market entirely, sitting on the sidelines while the recovery happens. This "market timing" attempt is the leading cause of retail underperformance compared to the indices.
The "Lost Decades" and the Necessity of Bonds
Critics of the 60/40 portfolio often point to "lost decades" for stocks (like 2000–2009) or "lost decades" for bonds (like the rising interest rate environment of the late 1940s to the 1970s). However, the beauty of the balanced model is that it rarely has a lost decade for both simultaneously.
When stocks are flat, bonds often provide the primary return through interest. When bonds are struggling (usually because interest rates are rising), it is often because the economy is strong, which typically benefits corporate earnings and stock prices. This inverse relationship is what has allowed the 60/40 portfolio to survive nearly 100 years of extreme macro-events.
Conclusion: Finding Your Balance
There is no "magic" number that works for every person. The 60/40 portfolio is a useful starting point—a historical benchmark that has proven its worth since 1926. But the Intelligent goal of asset allocation is to find a strategy that allows you to sleep through the "worst years" while still participating in the "average returns."
Whether you choose an 80/20, a 60/40, or a 40/60 mix, the most important factor represents consistency. Wealth is rarely built by picking the perfectly "optimal" allocation; it is built by picking a sustainable allocation and maintaining it through the inevitable peaks and valleys of the market cycle.
For further diversification beyond stocks and bonds, consider adding REITs to your portfolio. Our REIT investing guide explains how real estate exposure can improve risk-adjusted returns without sacrificing growth. You can also explore broader diversification strategies and passive income approaches in our Passive Income guide.
Sources and References